Calculated Risk

Hotels: Occupancy Rate Increased 2.1% Year-over-year

From STR: U.S. hotel results for week ending 11 May
The U.S. hotel industry reported higher performance from the previous week and positive comparisons year over year, according to CoStar’s latest data through 11 May. ...

5-11 May 2024 (percentage change from comparable week in 2023):

Occupancy: 66.1% (+2.1%)
• Average daily rate (ADR): US$162.14 (+4.4%)
• Revenue per available room (RevPAR): US$107.24 (+6.6%)
emphasis added
The following graph shows the seasonal pattern for the hotel occupancy rate using the four-week average.
Hotel Occupancy RateClick on graph for larger image.

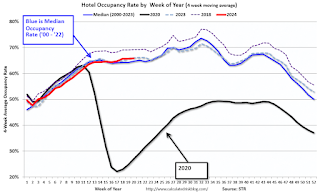
The red line is for 2024, black is 2020, blue is the median, and dashed light blue is for 2023.  Dashed purple is for 2018, the record year for hotel occupancy. 
The 4-week average of the occupancy rate is tracking last year, and slightly above the median rate for the period 2000 through 2023 (Blue).

Note: Y-axis doesn't start at zero to better show the seasonal change.
The 4-week average of the occupancy rate will move mostly sideways seasonally until the summer travel season.

Lawler: Early Read on Existing Home Sales in April & 3rd Look at Local Housing Markets

Today, in the Calculated Risk Real Estate Newsletter: Lawler: Early Read on Existing Home Sales in April & 3rd Look at Local Housing Markets

A brief excerpt:
From housing economist Tom Lawler:

Based on publicly-available local realtor/MLS reports released across the country through today, I project that existing home sales as estimated by the National Association of Realtors ran at a seasonally adjusted annual rate of 4.23 million in April, up 1.0% from March’s preliminary pace and up 0.2% from last April’s seasonally adjusted pace.  Unadjusted sales should show a significantly larger YOY % increase, as there were two more business days this April compared to last April.

  Local realtor/MLS reports suggest that the median existing single-family home sales price last month was up by about 6% from last April.

CR Note: The NAR is scheduled to release April existing home sales on Wednesday, May 22nd. The consensus is for 4.18 million SAAR, down from 4.19 million in March.
...
Closed Existing Home SalesThis is a year-over-year increase NSA for these markets. However, there were two more working days in April 2024 compared to April 2023, so sales Seasonally Adjusted will be lower year-over-year than Not Seasonally Adjusted sales.

If sales increased YoY in April, this will be the first YoY increase since August 2021, following 31 consecutive months with a YoY decline in sales.
There is much more in the article.

Early Q2 GDP Tracking: 1.9% to 3.6%

From BofA:
2Q US GDP tracking is down a tenth from our official forecast of 2.0% q/q saar to 1.9% q/q saar [May 17th estimate]
emphasis added
From Goldman:
We raised our Q2 GDP tracking estimate by 0.2pp to +3.2% (qoq ar) and our domestic final sales estimate by 0.1pp to +2.5%, but we lowered our past-quarter GDP tracking estimate for Q1 by 0.1pp to +1.2% (vs. +1.6% originally reported). [May 16th estimate]
And from the Altanta Fed: GDPNow
The GDPNow model estimate for real GDP growth (seasonally adjusted annual rate) in the second quarter of 2024 is 3.6 percent on May 16, down from 3.8 percent on May 15. [May 16th estimate]

Realtor.com Reports Active Inventory Up 35.0% YoY; Most Home For Sale Since August 2020

What this means: On a weekly basis, Realtor.com reports the year-over-year change in active inventory and new listings. On a monthly basis, they report total inventory. For April, Realtor.com reported inventory was up 30.4% YoY, but still down almost 36% compared to April 2017 to 2019 levels. 
 Now - on a weekly basis - inventory is up 35.0% YoY.

Realtor.com has monthly and weekly data on the existing home market. Here is their weekly report: Weekly Housing Trends View—Data for Week Ending May 11, 2024
Active inventory increased, with for-sale homes 35.0% above year-ago levels.

For the 27th straight week, there were more homes listed for sale versus the prior year, giving homebuyers more options. In fact, last week saw the highest number of homes for sale since August 2020, a significant milestone. Though new listing activity has softened, the recent strength in listing activity means buyers are seeing more homes for sale than they have in almost 4 years. Though buyers are seeing more options at a national level, inventory abundance varies geographically. The South leads the way in inventory growth, with a 43.0% increase in inventory annually in April, while the Northeast saw inventory increase just 4.0%.

New listings–a measure of sellers putting homes up for sale–were up this week, by 6.6% from one year ago.

Seller activity continued to climb annually last week and accelerated relative to the previous week’s growth. However, the annual increase in new listings was lower than almost every week back to early February, signifying a slowdown in new listings growth. .
Realtor YoY Active ListingsHere is a graph of the year-over-year change in inventory according to realtor.com

Inventory was up year-over-year for the 27th consecutive week.  
However, inventory is still historically very low.
New listings remain below typical pre-pandemic levels although up year-over-year.

MBA: Mortgage Delinquencies Increased Slightly in Q1 2024

Today, in the Calculated Risk Real Estate Newsletter: MBA: Mortgage Delinquencies Increased Slightly in Q1 2024

A brief excerpt:
From the MBA: Mortgage Delinquencies Increase Slightly in the First Quarter of 2024
The delinquency rate for mortgage loans on one-to-four-unit residential properties increased to a seasonally adjusted rate of 3.94 percent of all loans outstanding at the end of the first quarter of 2024, according to the Mortgage Bankers Association’s (MBA) National Delinquency Survey.
MBA National Delinquency Survey Q1 2024The following graph shows the percent of loans delinquent by days past due. Overall delinquencies increased slightly in Q1. The sharp increase in 2020 in the 90-day bucket was due to loans in forbearance (included as delinquent, but not reported to the credit bureaus).

The percent of loans in the foreclosure process decreased year-over-year from 0.57 percent in Q1 2023 to 0.46 percent in Q1 2024 (red), even with the end of the foreclosure moratoriums, and remains historically low.
...
The primary concern is the increase in 30- and 60-day delinquency rates, and even though the rate is historically low, it has increased from 2.32% in Q1 2023 to 2.92% in Q1 2024. I don’t think this increase is much of a worry, but it is something to watch.
There is much more in the article.

Single Family Starts Up 18% Year-over-year in March; Multi-Family Starts Down Sharply YoY

Today, in the Calculated Risk Real Estate Newsletter: Single Family Starts Up 18% Year-over-year in March; Multi-Family Starts Down Sharply YoY

A brief excerpt:
Total housing starts in April were above expectations, however, starts in February and March were revised down.

The third graph shows the month-to-month comparison for total starts between 2023 (blue) and 2024 (red).

Starts 2022 vs 2023Total starts were down 0.6% in April compared to April 2023.

The YoY decline was due to the sharp YoY decrease in multi-family starts.

Industrial Production Unchanged in April

From the Fed: Industrial Production and Capacity Utilization
Industrial production was little changed in April. Manufacturing output decreased 0.3 percent; excluding motor vehicles and parts, manufacturing output edged down 0.1 percent. The index for mining fell 0.6 percent, and the index for utilities rose 2.8 percent. At 102.8 percent of its 2017 average, total industrial production in April was 0.4 percentage point lower than its year-earlier level. Capacity utilization moved down to 78.4 percent in April, a rate that is 1.2 percentage points below its long-run (1972–2023) average.
emphasis added
Capacity UtilizationClick on graph for larger image.

This graph shows Capacity Utilization. This series is up from the record low set in April 2020, and above the level in February 2020 (pre-pandemic).

Capacity utilization at 78.4% is 1.2% below the average from 1972 to 2022.  This was at consensus expectations.

Note: y-axis doesn't start at zero to better show the change.

Industrial Production The second graph shows industrial production since 1967.

Industrial production was unchanged at 102.8. This is above the pre-pandemic level.

Industrial production was below consensus expectations.

Housing Starts Increased to 1.360 million Annual Rate in April

From the Census Bureau: Permits, Starts and Completions
Housing Starts:
Privately‐owned housing starts in April were at a seasonally adjusted annual rate of 1,360,000. This is 5.7 percent above the revised March estimate of 1,287,000, but is 0.6 percent below the April 2023 rate of 1,368,000. Single‐family housing starts in April were at a rate of 1,031,000; this is 0.4 percent below the revised March figure of 1,035,000. The April rate for units in buildings with five units or more was 322,000.

Building Permits:
Privately‐owned housing units authorized by building permits in April were at a seasonally adjusted annual rate of 1,440,000. This is 3.0 percent below the revised March rate of 1,485,000 and is 2.0 percent below the April 2023 rate of 1,470,000. Single‐family authorizations in April were at a rate of 976,000; this is 0.8 percent below the revised March figure of 984,000. Authorizations of units in buildings with five units or more were at a rate of 408,000 in April.
emphasis added
Multi Housing Starts and Single Family Housing StartsClick on graph for larger image.

The first graph shows single and multi-family housing starts since 2000.

Multi-family starts (blue, 2+ units) increased in April compared to March.   Multi-family starts were down 33.1% year-over-year.

Single-family starts (red) decreased slightly in April and were up 17.7% year-over-year.

Multi Housing Starts and Single Family Housing StartsThe second graph shows single and multi-family housing starts since 1968.

This shows the huge collapse following the housing bubble, and then the eventual recovery - and the recent collapse and recovery in single-family starts.

Total housing starts in April were above expectations, however, starts in February and March were revised down.

I'll have more later …

Weekly Initial Unemployment Claims Decrease to 222,000

The DOL reported:
In the week ending May 11, the advance figure for seasonally adjusted initial claims was 222,000, a decrease of 10,000 from the previous week's revised level. The previous week's level was revised up by 1,000 from 231,000 to 232,000. The 4-week moving average was 217,750, an increase of 2,500 from the previous week's revised average. The previous week's average was revised up by 250 from 215,000 to 215,250.
emphasis added
The following graph shows the 4-week moving average of weekly claims since 1971.

Click on graph for larger image.

The dashed line on the graph is the current 4-week average. The four-week average of weekly unemployment claims increased to 217,750.

The previous week was revised up.

Weekly claims were at the consensus forecast.

Thursday: Housing Starts, Unemployment Claims, Industrial Production, Philly Fed Mfg

Mortgage Rates Note: Mortgage rates are from MortgageNewsDaily.com and are for top tier scenarios.

Thursday:
• At 8:30 AM ET, Housing Starts for April. The consensus is for 1.410 million SAAR, up from 1.321 million SAAR in March.

• Also at 8:30 AM, The initial weekly unemployment claims report will be released.  The consensus is for 222 thousand initial claims, down from 231 thousand last week.

• Also at 8:30 AM, the Philly Fed manufacturing survey for May. The consensus is for a reading of 8.0, down from 15.5.

• At 9:15 AM, The Fed will release Industrial Production and Capacity Utilization for April. The consensus is for a 0.2% increase in Industrial Production, and for Capacity Utilization to be unchanged at 78.4%.

Cleveland Fed: Median CPI increased 0.3% and Trimmed-mean CPI increased 0.3% in April

The Cleveland Fed released the median CPI and the trimmed-mean CPI.

According to the Federal Reserve Bank of Cleveland, the median Consumer Price Index rose 0.3% in April. The 16% trimmed-mean Consumer Price Index increased 0.3%. "The median CPI and 16% trimmed-mean CPI are measures of core inflation calculated by the Federal Reserve Bank of Cleveland based on data released in the Bureau of Labor Statistics’ (BLS) monthly CPI report".

Inflation Measures Click on graph for larger image.

This graph shows the year-over-year change for these four key measures of inflation. 
On a year-over-year basis, the median CPI rose 4.5% (down from 4.6% in March), the trimmed-mean CPI rose 3.5% (down from 3.6%), and the CPI less food and energy rose 3.6% (down from 3.8%). 
Core PCE is for March was up 2.8% YoY, down slightly from 2.8% in February.
Note: The Cleveland Fed released the median CPI details. Rent and Owner's equivalent rent are still very high, and if we exclude rent, median CPI would be around 2% year-over-year. 

NAHB: Builder Confidence Declined in May

The National Association of Home Builders (NAHB) reported the housing market index (HMI) was at 45, down from 51 last month. Any number below 50 indicates that more builders view sales conditions as poor than good.

From the NAHB: Higher Mortgage Rates Hammer Builder Confidence in May
With mortgage rates averaging above 7% for the past four weeks per data from Freddie Mac, builder sentiment posted its first decline since November 2023.

Builder confidence in the market for newly built single-family homes was 45 in May, down six points from April, according to the National Association of Home Builders (NAHB)/Wells Fargo Housing Market Index (HMI) released today.

“The market has slowed down since mortgage rates increased and this has pushed many potential buyers back to the sidelines,” said NAHB Chairman Carl Harris, a custom home builder from Wichita, Kan. “We are also concerned about the recent codes rules that require HUD and USDA to insure mortgages for new single-family homes only if they are built to the 2021 International Energy Conservation Code. This will further increase the cost of construction in a market that sorely needs more inventory for first-time and first-generation buyers.”

“A lack of progress on reducing inflation pushed long-term interest rates higher in the first quarter and this is acting as a drag on builder sentiment,” said NAHB Chief Economist Robert Dietz. “The last leg in the inflation fight is to reduce shelter inflation, and this can only occur if builders are able to construct more attainable, affordable housing.”

The May HMI survey also revealed that 25% of builders cut home prices to bolster sales in May, ending four months of consecutive declines in this metric. However, the average price reduction in May held steady at 6% for the 11th straight month. Meanwhile, the use of sales incentives ticked up to 59% in May from a reading of 57% in April.
...
All three HMI component indices posted declines in May. The HMI index charting current sales conditions in May fell six points to 51, the component measuring sales expectations in the next six months fell nine points to 51 and the gauge charting traffic of prospective buyers declined four points to 30.

Looking at the three-month moving averages for regional HMI scores, the Midwest increased three points to 49, the Northeast fell two points to 61, the South dropped two points to 49 and the West posted a four-point decline to 43.
emphasis added
NAHB HMI Click on graph for larger image.

This graph shows the NAHB index since Jan 1985.

This was below the consensus forecast.

YoY Measures of Inflation: Services, Goods and Shelter

Here are a few measures of inflation:

The first graph is the one Fed Chair Powell had mentioned when services less rent of shelter was up around 8% year-over-year.  This declined, but has turned up recently, and is now up 4.9% YoY.

Services ex-ShelterClick on graph for larger image.

This graph shows the YoY price change for Services and Services less rent of shelter through April2024.
Services were up 5.2% YoY as of April 2024, down from 5.3% YoY in March.

Services less rent of shelter was up 4.9% YoY in April, up from 4.8% YoY in March.
Goods CPIThe second graph shows that goods prices started to increase year-over-year (YoY) in 2020 and accelerated in 2021 due to both strong demand and supply chain disruptions.

Durables were at -3.2% YoY as of April 2024, down from -2.1% YoY in March.

Commodities less food and energy commodities were at -1.2% YoY in April, down from -0.7% YoY in March.
ShelterHere is a graph of the year-over-year change in shelter from the CPI report (through April) and housing from the PCE report (through March)

Shelter was up 5.5% year-over-year in April, down from 5.6% in March. Housing (PCE) was up 5.79% YoY in March, down slightly from 5.85% in February.
This is still catching up with private data.  The BLS noted this morning: "The index for shelter rose in April, as did the index for gasoline. Combined, these two indexes contributed over seventy percent of the monthly increase in the index for all items."
Core CPI ex-shelter was up 2.1% YoY in April, down from 2.4% in March.

Retail Sales "Unchanged" in April

On a monthly basis, retail sales were "virtually unchanged" from March to April (seasonally adjusted), and sales were up 3.0 percent from April 2023.

From the Census Bureau report:
Advance estimates of U.S. retail and food services sales for April 2024, adjusted for seasonal variation and holiday and trading-day differences, but not for price changes, were $705.2 billion, virtually unchanged from the previous month, but up 3.0 percent above April 2023. ... The February 2024 to March 2024 percent change was revised from up 0.7 percent to up 0.6 percent (±0.1 percent).
emphasis added
Retail Sales Click on graph for larger image.

This graph shows retail sales since 1992. This is monthly retail sales and food service, seasonally adjusted (total and ex-gasoline).

Retail sales ex-gasoline were down 0.2% in April.

The second graph shows the year-over-year change in retail sales and food service (ex-gasoline) since 1993.

Retail and Food service sales, ex-gasoline, increased by 3.0% on a YoY basis.

Year-over-year change in Retail Sales The change in sales in April was below expectations, and, sales in February and March were revised down.

BLS: CPI Increased 0.3% in March; Core CPI increased 0.3%

From the BLS:
The Consumer Price Index for All Urban Consumers (CPI-U) increased 0.3 percent in April on a seasonally adjusted basis, after rising 0.4 percent in March, the U.S. Bureau of Labor Statistics reported today. Over the last 12 months, the all items index increased 3.4 percent before seasonal adjustment.

The index for shelter rose in April, as did the index for gasoline. Combined, these two indexes contributed over seventy percent of the monthly increase in the index for all items. The energy index rose 1.1 percent over the month. The food index was unchanged in April. The food at home index declined 0.2 percent, while the food away from home index rose 0.3 percent over the month.

The index for all items less food and energy rose 0.3 percent in April, after rising 0.4 percent in each of the 3 preceding months. Indexes which increased in April include shelter, motor vehicle insurance, medical care, apparel, and personal care. The indexes for used cars and trucks, household furnishings and operations, and new vehicles were among those that decreased over the month.

The all items index rose 3.4 percent for the 12 months ending April, a smaller increase than the 3.5-percent increase for the 12 months ending March. The all items less food and energy index rose 3.6 percent over the last 12 months. The energy index increased 2.6 percent for the 12 months ending April. The food index increased 2.2 percent over the last year.
emphasis added
The change in both CPI and core CPI were at expectations. I'll post a graph later today after the Cleveland Fed releases the median and trimmed-mean CPI.

MBA: Mortgage Applications Increased in Weekly Survey

From the MBA: Mortgage Applications Increase in Latest MBA Weekly Survey
Mortgage applications increased 0.5 percent from one week earlier, according to data from the Mortgage Bankers Association’s (MBA) Weekly Mortgage Applications Survey for the week ending May 10, 2024.

The Market Composite Index, a measure of mortgage loan application volume, increased 0.5 percent on a seasonally adjusted basis from one week earlier. On an unadjusted basis, the Index increased 0.3 percent compared with the previous week. The Refinance Index increased 5 percent from the previous week and was 7 percent higher than the same week one year ago. The seasonally adjusted Purchase Index decreased 2 percent from one week earlier. The unadjusted Purchase Index decreased 2 percent compared with the previous week and was 14 percent lower than the same week one year ago.

“Treasury yields continued to move lower last week and mortgage rates declined for the second week in a row, with the 30-year fixed rate down 10 basis points to 7.08 percent, the lowest level since early April,” said Joel Kan, MBA’s Vice President and Deputy Chief Economist. “The decline in rates led to a small boost to refinance applications, including another strong week for VA refinances. However, the overall level of refinance activity remains low. Purchase applications decreased, driven largely by a 9 percent drop in FHA purchase applications. Conventional home purchase applications were down around one percent.

Added Kan, “While the downward move in rates benefits prospective homebuyers, mortgage rates are still much higher than they were a year ago, while for-sale inventory remains tight.”
...
The average contract interest rate for 30-year fixed-rate mortgages with conforming loan balances ($766,550 or less) decreased to 7.08 percent from 7.18 percent, with points decreasing to 0.63 from 0.65 (including the origination fee) for 80 percent loan-to-value ratio (LTV) loans.
emphasis added
Mortgage Purchase IndexClick on graph for larger image.

The first graph shows the MBA mortgage purchase index.

According to the MBA, purchase activity is down 14% year-over-year unadjusted.  
Red is a four-week average (blue is weekly).  
Purchase application activity is up slightly from the lows in late October 2023, and below the lowest levels during the housing bust.  

Mortgage Refinance IndexThe second graph shows the refinance index since 1990.

With higher mortgage rates, the refinance index declined sharply in 2022, and has mostly flat lined since then.

Wednesday: CPI, Retail Sales, NY Fed Mfg, Homebuilder Survey

Mortgage Rates Note: Mortgage rates are from MortgageNewsDaily.com and are for top tier scenarios.

Wednesday:
• At 7:00 AM ET, The Mortgage Bankers Association (MBA) will release the results for the mortgage purchase applications index.

• At 8:30 AM, The Consumer Price Index for April from the BLS. The consensus is for 0.3% increase in CPI (up 3.4% YoY), and a 0.3% increase in core CPI (up 3.6% YoY).

• Also at 8:30 AM, Retail sales for April is scheduled to be released.  The consensus is for 0.4% increase in retail sales.

• Also at 8:30 AM, The New York Fed Empire State manufacturing survey for May. The consensus is for a reading of -10.8, up from -14.3.

• At 10:00 AM, The May NAHB homebuilder survey. The consensus is for a reading of 51 unchanged from 51 last month.  Any number below 50 indicates that more builders view sales conditions as poor than good.

Part 2: Current State of the Housing Market; Overview for mid-May 2024

Today, in the Calculated Risk Real Estate Newsletter: Part 2: Current State of the Housing Market; Overview for mid-May 2024

A brief excerpt:
On Friday, in Part 1: Current State of the Housing Market; Overview for mid-May 2024 I reviewed home inventory, housing starts and sales.

In Part 2, I will look at house prices, mortgage rates, rents and more.
...
Freddie Case-Shiller NAR House PricesOther measures of house prices suggest prices will be up about the same YoY in the March Case-Shiller index. The NAR reported median prices were up 4.8% YoY in March, up from 5.6% YoY in February. ICE reported prices were up 5.6% YoY in March, down from 6.0% YoY in February, and Freddie Mac reported house prices were up 6.6% YoY in March, up from 6.5% YoY in February.

Here is a comparison of year-over-year change in the FMHPI, median house prices from the NAR, and the Case-Shiller National index.

The FMHPI and the NAR median prices appear to be leading indicators for Case-Shiller. Based on recent monthly data, and the FMHPI, the YoY change in the Case-Shiller index will likely be about the same YoY in March as in February.
There is much more in the article.

NY Fed Q1 Report: Household Debt and Delinquency Rates Increased

From the NY Fed: Household Debt Rose by $184 Billion in Q1 2024; Delinquency Transition Rates Increased Across All Debt Types
The Federal Reserve Bank of New York’s Center for Microeconomic Data today issued its Quarterly Report on Household Debt and Credit. The report shows total household debt increased by $184 billion (1.1%) in the first quarter of 2024, to $17.69 trillion. The report is based on data from the New York Fed’s nationally representative Consumer Credit Panel.

The New York Fed also issued an accompanying Liberty Street Economics blog post examining credit card utilization and its relationship with delinquency. The Quarterly Report also includes a one-page summary of key takeaways and their supporting data points.

“In the first quarter of 2024, credit card and auto loan transition rates into serious delinquency continued to rise across all age groups,” said Joelle Scally, Regional Economic Principal within the Household and Public Policy Research Division at the New York Fed. “An increasing number of borrowers missed credit card payments, revealing worsening financial distress among some households.”

Mortgage balances rose by $190 billion from the previous quarter and was $12.44 trillion at the end of March. Balances on home equity lines of credit (HELOC) increased by $16 billion, representing the eighth consecutive quarterly increase since Q1 2022, and now stand at $376 billion. Credit card balances decreased by $14 billion to $1.12 trillion. Other balances, which include retail cards and consumer loans, also decreased by $11 billion. Auto loan balances increased by $9 billion, continuing the upward trajectory seen since 2020, and now stand at $1.62 trillion.

Mortgage originations continued increasing at the same pace seen in the previous three quarters, and now stand at $403 billion. Aggregate limits on credit card accounts increased modestly by $63 billion, representing a 1.3% increase from the previous quarter. Limits on HELOC grew by $30 billion and have grown by 14% over the past two years, after 10 years of observed declines.

Aggregate delinquency rates increased in Q1 2024, with 3.2% of outstanding debt in some stage of delinquency at the end of March. Delinquency transition rates increased for all debt types. Annualized, approximately 8.9% of credit card balances and 7.9% of auto loans transitioned into delinquency. Delinquency transition rates for mortgages increased by 0.3 percentage points yet remain low by historic standards.
emphasis added
Total Household Debt Click on graph for larger image.

Here are three graphs from the report:

The first graph shows household debt increased in Q1.  Household debt previously peaked in 2008 and bottomed in Q3 2013. Unlike following the great recession, there wasn't a decline in debt during the pandemic.

From the NY Fed:
Aggregate household debt balances increased by $184 billion in the first quarter of 2024, a 1.1% rise from 2023Q4. Balances now stand at $17.69 trillion and have increased by $3.5 trillion since the end of 2019, just before the pandemic recession.
Delinquency Status The second graph shows the percent of debt in delinquency.

The overall delinquency rate increased in Q1.  From the NY Fed:
Aggregate delinquency rates increased in the first quarter of 2024. As of March, 3.2% of outstanding debt was in some stage of delinquency, up by 0.1 percentage point from the fourth quarter. Still, overall delinquency rates remain 1.5 percentage points lower than the fourth quarter of 2019.
Mortgage Originations by Credit Score The third graph shows Mortgage Originations by Credit Score.

From the NY Fed:
Credit quality of newly originated loans was steady, with 3% of mortgages and 16% of auto loans originated to borrowers with credit scores under 620, roughly unchanged from the fourth quarter. The median credit score for newly originated mortgages was flat at 770, while the median credit score of newly originated auto loans was four points higher than last quarter at 724, the highest on record.
There is much more in the report.

CPI Previews

CPI for April will be released on Wednesday. The consensus is for 0.3% increase in CPI (up 3.4% YoY), and a 0.3% increase in core CPI (up 3.6% YoY). Here are a couple of analyst's forecasts.

From BofA:
For the April CPI report, we forecast headline CPI rose by 0.3% m/m. Based on our forecast, the y/y rate should tick down to 3.4%. The main factor behind our expectation for a relatively firmer headline CPI print is energy prices. Meanwhile, we expect core inflation to also print at 0.3% m/m. This would be a noticeable moderation from the 0.37% m/m 1Q average.
From Goldman:
We expect a 0.28% increase in April core CPI (vs. 0.3% consensus), corresponding to a year-over-year rate of 3.61% (vs. 3.6% consensus). We expect a 0.37% increase in April headline CPI (vs. 0.4% consensus), which corresponds to a year-over-year rate of 3.42% (vs. 3.4% consensus). Our forecast is consistent with a 0.19% increase in CPI core services excluding rent and owners’ equivalent rent and with a 0.22% increase in core PCE in April. ... Going forward, we expect monthly core CPI inflation to remain in the 0.25-0.30% range for the next few months before slowing to around 0.2% by end-2024.

Pages